Research and Development
| After many years of research, PIA has developed a technology which permits measurement of high IR flicker frequencies of a flame. More precisely, this technique allows detecting and analyzing all the variations existing in the IR signals, and not only those present in the flame envelop. Thus, this technology makes it possible to verify existence of IR flicker frequencies going up to 5000 Hz. |
| Below are three wave forms of flames, as recorded on the field. These graphics illustrate the flicker frequencies detected by our system, in the 900 to 1700 nanometres infrared region. |
Figure 1 – IR signal of a pulverized coal flame |
|
 |
|
Figure 2 – IR signal of a natural gas flame |
|
 |
|
Figure 3 – IR signal of a heavy oil flame |
|
 |
| Most of time, these high frequencies are considered as noise, and not as a part of the flame signal, but our team has discovered that the high IR flicker frequencies are very present and stable, and are an integral part of the flame. |
| Until now, the flame detection technology used in the combustion industry did not permit to verify if there were high frequencies in flames. Also, we developed flame detectors able to read these frequencies, which ensure a better characterization of the flame, a more precise discrimination, and a better adjustment. |
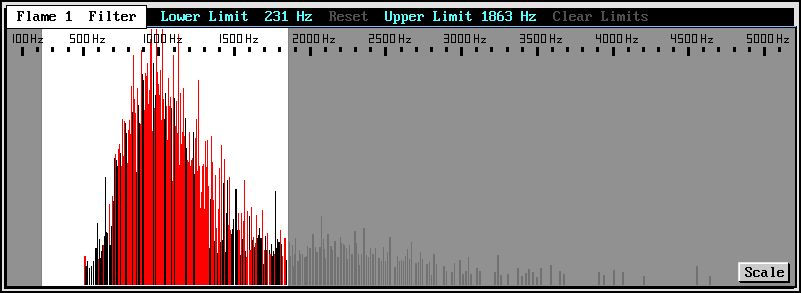
| PIA still pursues researches on the detection of high IR flicker frequencies and the results of our analyses led us to develop advanced technics and many enhanced features, including a frequency decomposition of the IR signal in real time adapted to random signals of a flame (see Figure 4) and its fully programmable software filters on all the range that allows the user to associate a flame to a specific range of IR frequencies. |
| A graphical user interface (GUI) has also been specifically designed to simplify the work of operators when adjustments in avoiding the complicated sequences and direct manipulation of numerical parameters. These new techniques have been implemented in our new flame scanners, namely the W143 Dual IR, the W146 Dual UV/IR and the Flamoptic under development. |
Figure 4 – Example of software filters |
|
 |
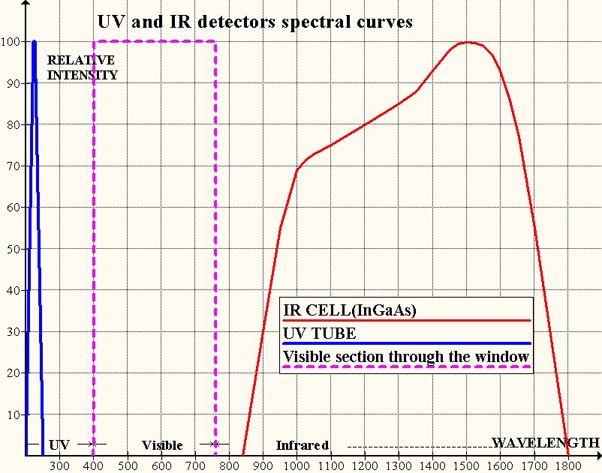
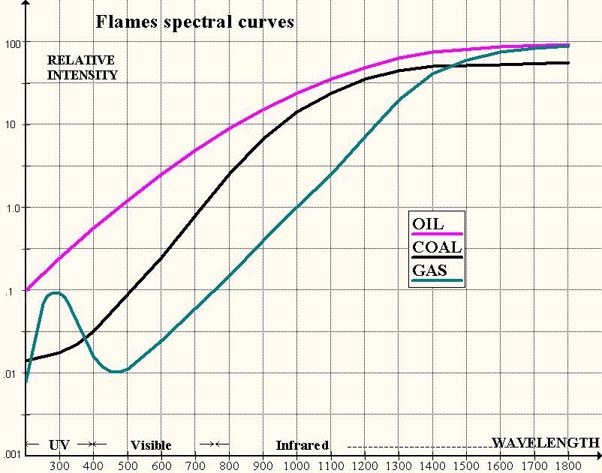
Spectral curves of sensors and fires produced by different fuels
| Spectral curves of the UV tube and the IR cell of our flame scanners (the visible section only concern the Window 141) | |
|
|
|
| Spectral curves of 3 different burning fuels. | |
|
|